DAILY REAL ESTATE NEWS | MONDAY, JANUARY 25, 2016
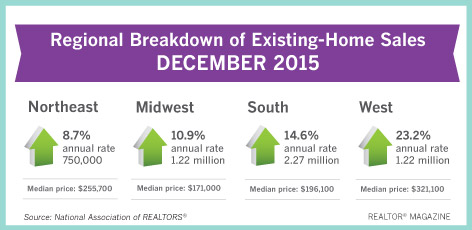
The end of the year brought a sizable boost to existing home sales, as delayed closings from new mortgage rules pushed some would-be November transactions to December, according to the National Association of REALTORS®. Existing-home sales — which are completed transactions for single-family homes, townhomes, condos, and co-ops — rose 14.7 percent month-over-month to a seasonally adjusted annual rate of 5.46 million in December. Sales are now 7.7 percent above a year ago.
That marks the best year of existing-home sales since 2006, though it’s still well below the record for that year, which was a whopping 6.48 million.
“While the carryover of November’s delayed transactions into December contributed greatly to the sharp increase, the overall pace taken together indicates sales these last two months maintained the healthy level of activity seen in most of 2015,” says Lawrence Yun, NAR’s chief economist. “Additionally, the prospect of higher mortgage rates in coming months and warm November and December weather allowed more homes to close before the end of the year.”
The Know Before You Owe initiative, which took effect Oct. 3, 2015, prompted some delays in closings as lenders adjusted to new rules and the rollout of a new mortgage form to consumers.
“December’s rebound in sales is reason for cautious optimism that the work to prepare for Know Before You Owe is paying off,” says NAR President Tom Salomone. “However, our data is still showing longer closing timeframes, which is a reminder that the near-term challenges we anticipated are still prevalent. NAR advised members to extend the time horizon on their purchase contracts to address this concern.”
5 Stats to Judge the Real Estate Market
1. Home prices: The median existing-home price for all housing types was $224,100 in December, up 7.6 percent year-over-year ($208,200).
2. Days on the market: Thirty-two percent of homes sold last month were on the market for less than a month. Properties, on average, stayed on the market for 58 days in December, which is below the 66 days in December 2014. Broken out, the properties on the market the longest amount of time in December were short sales, which had a median of 86 days. Foreclosures sold in 68 days, on average, while non-distressed homes took 57 days.
3. All-cash sales: All-cash transactions comprised 24 percent of transactions in December, down from 26 percent a year ago. Individual investors, who account for the bulk of cash sales, purchased 15 percent of homes in December, down from 17 percent a year ago.
4. Distressed sales: Foreclosures and short sales dropped to 8 percent in December, down from 11 percent a year ago. Of that, foreclosures made up 6 percent of December sales and short sales comprised 2 percent. Foreclosures sold for an average discount of 16 percent below market value last month, while short sales were discounted 15 percent, on average.
5. Inventory: By the end of December, total housing inventory fell 12.3 percent to 1.79 million existing homes available for sale, reaching a 3.9-month supply at the current sales pace. That is 3.8 percent lower than a year ago (1.86 million).
“Although some growth is expected, the housing market will struggle in 2016 to replicate last year’s 7 percent increase in sales,” says Yun. “In addition to insufficient supply levels, the overall pace of sales this year will be constricted by tepid economic expansion, rising mortgage rates and decreasing demand for buying in oil-producing metro areas.”
Source: National Association of REALTORS®