DOWNTOWN PHOENIX LIFE

Life in Downtown Phoenix

Downtown Phoenix LifeDowntown Phoenix life is now fun. The land areas have changed and the growth has been tremendous. There’s been a lot of changes over the years.
The City of Phoenix defines Downtown as the area between 7th Street and 7th Avenue, from McDowell Road on the north to Buckeye Road on the south. However, the majority of downtown development is concentrated in the smaller area surrounding the intersection of Washington St. and Central Avenue.

Downtown Phoenix is one of a the few major business districts in the city and is the central business district of the City of Phoenix, Arizona.

It’s located in the heart of the Phoenix metropolitan area or ‘Valley of the Sun’ with a large variety of designated historic districts housing some classic, vintage homes attracting people from all walks of life.

Phoenix, being the county seat of Maricopa County and the capital of Arizona, serves as the center of politics, justice and government on the local, state and federal levels. The area is a major center of employment for the region, with many financial, legal, and other national and international corporations housed in a variety of skyscrapers. Major arts and cultural institutions also call the area home.

Downtown Phoenix is a center of major league sports activities, live concert events, and is an equally prominent center of banking and finance in Arizona. Regional headquarters for several major banks, including JP Morgan Chase, Wells Fargo, US Bank, Bank of America, Compass Bank and MidFirst Bank are all located within or close proximity to the area.

A Little History of Downtown Phoenix

Territorial era

In 1870, a meeting was held to select a town site for the influx of pioneers coming to the recently recognized town of Phoenix. 320 acres were purchased for $50 raised by popular subscription. This original site, the whole of the town of Phoenix in that day, encompasses what would presently be the Downtown Core, bordered by Van Buren Street south to Jackson Street, and Seventh Street to Seventh Avenue.

With the first survey of the new town, streets were laid out in a grid, with Washington Street as the main east-west thoroughfare. The north-south streets originally bore Native American tribal names, but were changed to more easily remembered numbers, with everything east of Center Street (later Central Avenue) named as streets and everything west as avenues. The town continued to grow, and was eventually incorporated as a city on February 28, 1881 centered around downtown.

Throughout the 1880s the newly incorporated city made many strides toward modernization with the construction of one of the first electric plants in the West as well as the opening of the horse-drawn streetcar line. The Phoenix Street Railway system was eventually electrified and expanded to several different lines that connected Downtown Phoenix to other neighborhoods and cities in the Valley.

Independence Day of 1887 heralded the arrival first Southern Pacific train. This opened up the economy of the young city, as goods now flowed in and out by train as opposed to wagon. As Phoenix became the center of commerce in the territory, the capital was moved to Phoenix, with temporary offices being set up in Downtown.

The city of Phoenix’s story begins as people from those settlements expanded south, in conjunction with the establishment of a military outpost to the east of current day Phoenix.

The town of Phoenix was settled in 1867, and incorporated in 1881 as the City of Phoenix. Phoenix served as an agricultural area that depended on large-scale irrigation projects. Until World War II, the economy was based on the “Five C’s”: cotton, citrus and cattle, climate and copper. The city provided retail, wholesale, banking, and governmental services for central Arizona, and was gaining a national reputation among winter tourists. The post-World War Two years saw the city beginning to grow more rapidly, as many men who had trained in the military installations in the valley, returned, bringing their families.

The population growth was further stimulated in the 1950s, in part because of the availability of air conditioning, which made the very hot dry summer heat tolerable, as well as an influx of industry, led by high tech companies.

The population growth rate of the Phoenix metro area has been nearly 4% per year for the past 40 years. That growth rate slowed during the Great Recession but the U.S. Census Bureau predicted it would resume as the nation’s economy recovered, and it already has begun to do so. While currently ranked 6th in population, it is predicted that Phoenix will rank 4th by 2020. Currently it the 6th most populous city in the United States.

Housing Affordability Still High, For Now

DAILY REAL ESTATE NEWS | TUESDAY, FEBRUARY 02, 2016

Housing Affordability Still High, For NowHome prices may have been on the rise the last few years, but homes are still more affordable now than they were in the pre-bubble years, according to the latest Mortgage Monitor Report released by Black Knight Financial Services.

Households are using 21 percent of the national median income to pay a mortgage on a median-priced home. In 2000-2002, the average payment-to-income ratio was 26 percent, and in 2006, it was 33 percent.

However, Black Knight’s report warns that if home prices continue to increase – as they have year-over-year for 43 consecutive months – the affordability picture in home ownership could start to change in two years.

Black Knight factored in a continuing 5.5 percent annual home price appreciation as well as interest rate rises of 50 basis points a year. Under that scenario, “we see that in two years home affordability will be pushing the upper bounds of that pre-bubble average,” says Ben Graboske, senior vice president at Black Knight Data and Analytics. “At the state level under that same scenario, eight states would be less affordable than 2000-2002 levels within 12 months and 22 states would be within 24 months.”

Graboske notes that Hawaii and Washington, D.C., in particular, are already less affordable than they were during the pre-bubble era. On the other hand, he says, even after 24 months under this scenario, Michigan – and a few other states – would still be much more affordable by the end of 2017 than it was in the early 2000s.

Within 12 months, the average mortgage payment is expected to rise by $114, which would then require 24 percent of a household’s monthly income – still below the 2000-2002 levels, according to Black Knight. But by the end of 2017, monthly mortgage payments are expected to be $240 more than today, which would push the tally to 26.5 percent of a household’s income and the upper levels of the pre-bubble averages, the report notes.

If you’re on the fence and are thinking about buying a home in Phoenix, please call Laura B.

These Are the ‘Happiest’ States in the U.S. Arizona Makes List

DAILY REAL ESTATE NEWS | TUESDAY, FEBRUARY 02, 2016

Downtown Phoenix Skyline

Hawaii reclaims its number one spot as the “happiest” state in the country – bumping out last year’s winner Alaska.

The state has held the happiness title five times since 2008, according to the latest Gallup-Healthways Well-Being Index.

The index measures the well-being of states across five elements: purpose, social, financial, community and physical. In 2015, financial well-being increased as well as physical fitness while there were also declines in both food and healthcare insecurity. What’s more, life evaluation – in which how Americans rate and perceive their lives – surged to a record high, according to the index.

“Well-being in the U.S. exhibits regional patterns, with the northern plains and mountain west reporting higher levels of well-being, along with some western states and pockets in the northeast and Atlantic states,” according to the report.

For 2015, here are the states that scored the highest in well-being, according to the index:

  1. Hawaii
  2. Alaska
  3. Montana
  4. Colorado
  5. Wyoming
  6. South Dakota
  7. Minnesota
  8. Utah
  9. Arizona
  10. California
  11. Texas
  12. Florida
  13. Wisconsin
  14. Iowa
  15. North Dakota

A State-by-State Look at Price Predictions

DAILY REAL ESTATE NEWS | WEDNESDAY, JANUARY 27, 2016

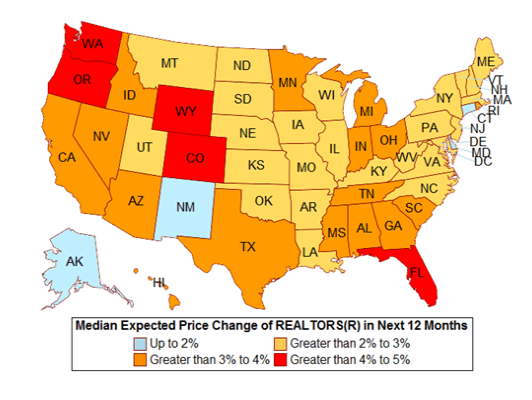
REALTORS® nationwide expect home prices to inch up 3.2 percent over the next 12 months, according to the latest REALTORS® Confidence Index Survey, based on a monthly survey of more than 50,000 NAR members about their local markets and most recent transactions.

Overall, real estate professionals expect the recent strong growth in home prices to moderate as rising prices hamper affordability in many areas.

NAR Price Predictions 2016

2016 State-by-State Price Predictions by the National Association of REALTORS

REALTORS® in Washington, Oregon, Wyoming, Colorado, and Florida are the most optimistic about price growth in the next year – with a median expected price growth of 4 to 5 percent.

The infographic above, from the REALTORS® Confidence Index Survey, breaks down expectations of REALTORS® on home prices over the next 12 months for each state.

The Best Year for Sales Since the Housing Boom

DAILY REAL ESTATE NEWS | MONDAY, JANUARY 25, 2016

Real Estate Sales Graph

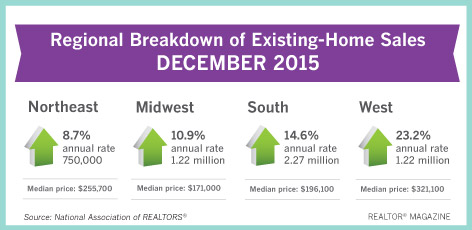
The end of 2016 brought a sizable boost to existing home sales, as delayed closings from new mortgage rules pushed some would-be November transactions to December, according to the National Association of REALTORS®. Existing-home sales — which are completed transactions for single-family homes, townhomes, condos, and co-ops — rose 14.7 percent month-over-month to a seasonally adjusted annual rate of 5.46 million in December. Sales are now 7.7 percent above a year ago.

That marks the best year of existing-home sales since 2006, though it’s still well below the record for that year, which was a whopping 6.48 million.

“While the carryover of November’s delayed transactions into December contributed greatly to the sharp increase, the overall pace taken together indicates sales these last two months maintained the healthy level of activity seen in most of 2015,” says Lawrence Yun, NAR’s chief economist. “Additionally, the prospect of higher mortgage rates in coming months and warm November and December weather allowed more homes to close before the end of the year.”

The Know Before You Owe initiative, which took effect Oct. 3, 2015, prompted some delays in closings as lenders adjusted to new rules and the rollout of a new mortgage form to consumers.

“December’s rebound in sales is reason for cautious optimism that the work to prepare for Know Before You Owe is paying off,” says NAR President Tom Salomone. “However, our data is still showing longer closing timeframes, which is a reminder that the near-term challenges we anticipated are still prevalent. NAR advised members to extend the time horizon on their purchase contracts to address this concern.”

5 Stats to Judge the Real Estate Market

1. Home prices: The median existing-home price for all housing types was $224,100 in December, up 7.6 percent year-over-year ($208,200).

2. Days on the market: Thirty-two percent of homes sold last month were on the market for less than a month. Properties, on average, stayed on the market for 58 days in December, which is below the 66 days in December 2014. Broken out, the properties on the market the longest amount of time in December were short sales, which had a median of 86 days. Foreclosures sold in 68 days, on average, while non-distressed homes took 57 days.

3. All-cash sales: All-cash transactions comprised 24 percent of transactions in December, down from 26 percent a year ago. Individual investors, who account for the bulk of cash sales, purchased 15 percent of homes in December, down from 17 percent a year ago.

4. Distressed sales: Foreclosures and short sales dropped to 8 percent in December, down from 11 percent a year ago. Of that, foreclosures made up 6 percent of December sales and short sales comprised 2 percent. Foreclosures sold for an average discount of 16 percent below market value last month, while short sales were discounted 15 percent, on average.

5. Inventory: By the end of December, total housing inventory fell 12.3 percent to 1.79 million existing homes available for sale, reaching a 3.9-month supply at the current sales pace. That is 3.8 percent lower than a year ago (1.86 million).

“Although some growth is expected, the housing market will struggle in 2016 to replicate last year’s 7 percent increase in sales,” says Yun. “In addition to insufficient supply levels, the overall pace of sales this year will be constricted by tepid economic expansion, rising mortgage rates and decreasing demand for buying in oil-producing metro areas.”

Source: National Association of REALTORS®

6 Stellar Reasons to Buy a Home in 2016

Buying a Home In 2016


Is it really 2016 already?  For those of you who happen to be planning on buying a home in the new year—or even just trying to—there’s a whole lot to celebrate. Why? A variety of financial vectors have dovetailed to make this the perfect storm for home buyers to get out there and make an (winning) offer. Here are six home-buying reasons to be thankful while ringing in the new year:

Reason No. 1: Interest rates are still at record lows

Even though they may creep up at any moment, it’s nonetheless a fact that interest rates on home loans are at historic lows, with a 30-year fixed-rate home loan still hovering around 4%.

“Remember 18.5% in the ’80s?” asks Tom Postilio, a real estate broker with Douglas Elliman Real Estate and a star of HGTV’s “Selling New York.”“It is likely that we’ll never see interest rates this low again. So while prices are high in some markets, the savings in interest payments could easily amount to hundreds of thousands of dollars over the life of the mortgage.”

Reason No. 2: Rents have skyrocketed

Another reason home buyers are lucky is that rents are going up, up, up! (This, on the other hand, is a reason not to be thankful if you’re a renter.) In fact, rents outpaced home values in 20 of the 35 biggest housing markets in 2015. What’s more, according to the 2015 Rent.com Rental Market Report, 88% of property managers raised their rent in the past 12 months, and an 8% hike is predicted for 2016.

“In most metropolitan cities, monthly rent is comparable to that of a monthly mortgage payment, sometimes more,” says Heather Garriock, mortgage agent for The Mortgage Group. “Doesn’t it make more sense to put those monthly chunks of money into your own appreciating asset rather than handing it over to your landlord and saying goodbye to it forever?”

Reason No. 3: Home prices are stabilizing

For the first time in years, prices that have been climbing steadily upward are stabilizing, restoring a level playing field that helps buyers drive a harder bargain with sellers, even in heated markets.

“Local markets vary, but generally we are experiencing a cooling period,” says Postilio. “At this moment, buyers have the opportunity to capitalize on this.”

Reason No. 4: Down payments don’t need to break the bank

Probably the biggest obstacle that prevents renters from becoming homeowners is pulling together a down payment. But today, that chunk of change can be smaller, thanks to a variety of programs to help home buyers. For instance, the new Fannie Mae and Freddie Mac Home Possible Advantage Program allows for a 3% down payment for credit scores as low as 620.

Reason No. 5: Mortgage insurance is a deal, too

If you do decide to put less than 20% down on a home, you are then required to have mortgage insurance (basically in case you default). A workaround to handle this, however, is to take out a loan from the Federal Housing Administration—a government mortgage insurer that backs loans with down payments as low as 3.5% and credit scores as low as 580. The fees are way down from 1.35% to 0.85% of the mortgage balance, meaning your monthly mortgage total will be significantly lower if you fund it this way. In fact, the FHA predicts this 37% annual premium cut will bring 250,000 first-time buyers into the market. Why not be one of them?

Reason No. 6: You’ll reap major tax breaks

Tax laws continue to favor homeowners, so you’re not just buying a place to live—you’re getting a tax break! The biggest one is that unless your home loan is more than $1 million, you can deduct all the monthly interest you are paying on that loan. Homeowners may also deduct certain home-related expenses and home property taxes.

by Kimberly Dawn Neumann

January is a Big Month for Listings!

For Buyers:
January is one of the top months for new listings to hit the market, making it a good time to start looking.  Buyers gain a negotiating advantage when there are more listings in competition with each other.

Typical inventory trends tell us that November through January are the peak months for buyers to have the maximum choice of properties before competing buyers begin dwindling the supply and their negotiating advantage. 

The market as a whole is still a seller’s market, meaning that supply is below normal for the level of demand out there.  This shortage is mostly for properties below $200,000. Expect more choice in the upper price ranges.

For Sellers:
Get ready for the beginning of the purchasing season!  The first week of the year is typically the lowest point for pending sales due to low buyer activity over the Christmas and New Year holidays.   

The lull doesn’t last for long, however.  January is a big time of year for large tourist events in the valley including the Barrett Jackson Car Show, Waste Management Open, Collegiate Football Championship and more. 

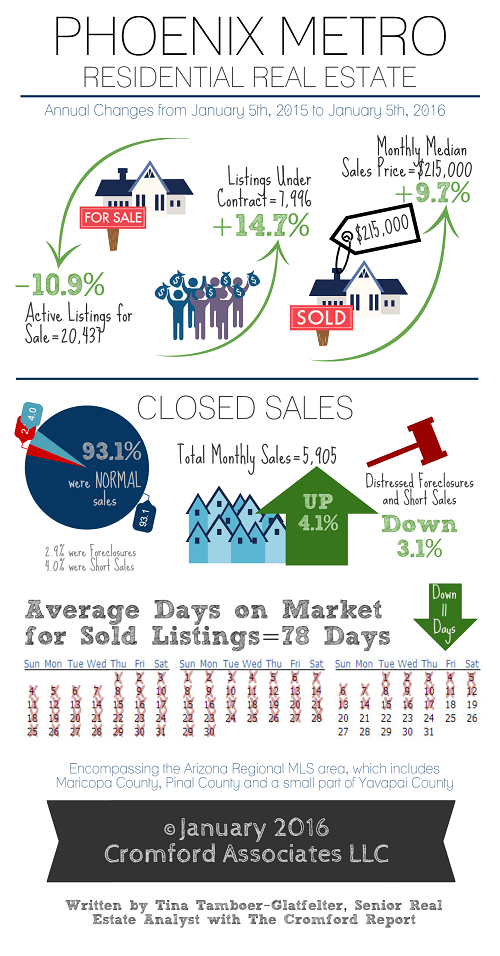
By February, open house traffic will pick up and a notable increase in contracts submitted.  In 2015, the number of contracts in escrow nearly doubled between January and June before submitting to the summer slowdown. 

This year, we’re starting off with 15% more properties in escrow compared to this time last year, a good sign for sellers to kick off the year.  There are still a significant number of boomerang buyers recovering their credit after foreclosures and short sales a few years ago, providing a healthy level of optimism for demand in 2016.

2016 Cromford Report For Buyers and Seller

Market Unrest Pushes Down Mortgage Rates

DAILY REAL ESTATE NEWS | FRIDAY, JANUARY 22, 2016

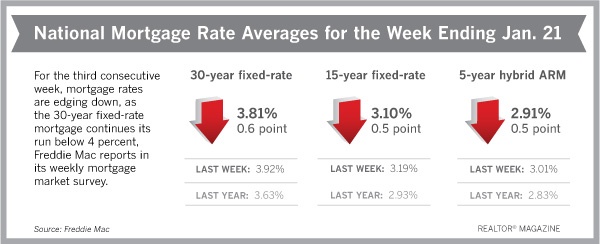
For the third consecutive week, mortgage rates in 2016 edged down, with the 30-year fixed-rate mortgage continuing its run below 4 percent, Freddie Mac reports in its weekly mortgage market survey.

“The Freddie Mac mortgage rate survey had difficulty keeping up with market events this week,” says Sean Becketti, Freddie Mac’s chief economist. “The 30-year mortgage rate dropped 11 basis points to 3.81 percent, the lowest rate in three months. 

This drop reflected weak inflation and nonstop financial market turbulence that is driving investors to the safe haven of Treasuries. However, the survey was largely complete prior to Wednesday’s Treasury rally that drove the yield on the 10-year Treasury below 2 percent, down 29 basis points since the end of 2015.”

Freddie Mac reports the following national averages with mortgage rates for the week ending Jan. 21:

  • 30-year fixed-rate mortgages: averaged 3.81 percent, with an average 0.6 point, dropping from last week’s 3.92 percent average. Last year at this time, 30-year rates averaged 3.63 percent.
  • 15-year fixed-rate mortgages: averaged 3.10 percent, with an average 0.5 point, falling from last week’s 3.19 percent average. A year ago, 15-year rates averaged 2.93 percent.
  • 5-year hybrid adjustable-rate mortgages: averaged 2.91 percent, with an average 0.5 point, dropping from last week’s 3.01 percent average. Last year at this time, 5-year ARMs averaged 2.83 percent.

It’s a fantastic time to buy a home while interest rates are still at historic lows.

2016 Interest Rate Graph

Interest Rate Chart January 2016

Source: Freddie Mac

Bond Rate Forecast for 2016

What will happen to bonds in 2016?

Next year may be a bumpy ride for fixed income. In 2016, the drivers of volatility will be the Fed and the economy.

“We are expecting a lot of uncertainty around the path of rates and when the Fed will hike rates (again),” says George Rusnak, co-head of global fixed income at the Wells Fargo Investment Institute.

He forecasts that 10-year U.S. Treasury notes will end 2016 from 2.5% to 2.75% after hitting 2.24% in late December 2015.

He expects a flattening of the yield curve, with the 30-year Treasury ending 2016 around 3% to 3.5% after reaching 2.95% in December 2015. The Treasury yield curve shows the yield on the most recent issuances of Treasury bills, notes and bonds.

Greg McBride, CFA, Bankrate’s chief financial analyst, also predicts further flattening, with the yield on the 1-year T-bill rising to 1.5% by the end of 2016 from 0.66% at the end of 2015.

“Any increases in longer-term rates will be considerably more restrained for much of 2016,” McBride says.

For Donald Cummings, founder and portfolio manager of Blue Haven Capital, the sweet spot for investors is in intermediate maturities. “With the (10-year) at 2.3%, I’m still in the 7- or 8-year maturities. But, if we get to 2.5% or 2.75%, I can go out into the 10-year or 12-year sector because then I’m getting compensated for going out,” he says.

Downtown & Central Phoenix Life Becoming a Nationwide Hotspot

The Downtown Phoenix Condo and Loft Scene

Downtown & Central Phoenix Life is rapidly changing. The number of high-rises, mid-rises and low-rises being built, restored and renovated have been absolutely BOOMING in Central Phoenix! These buildings are old mixed in with new and provide amenities galore.

The Downtown Phoenix Condo and Loft SceneDowntown Phoenix is the new home of loft traditions where space and creativity have been merging into stylistic, personalized urban expression.

Many industrial buildings have been converted into desirable, luxurious, lofts or condominiums for your taking. If a single-family home is not for you but simple living is, (no yard responsibilities, etc.), then you’ve come to the right place. Or maybe you’re an artist looking to live where you work. I have ideas for you.

Here, you will find real-time, live listings of all Downtown, Central and North Phoenix condos for sale, Urban Lofts for sale, Condos in High-Rises for sale, and pretty much any dwelling type that is not a single-family home. Whether you wish to buy, sell, renovate or design a loft or condominium in Phoenix, HistoricPhoenixDistricts.com and Downtown Life has the property and solution for you.

Downtown and Central Phoenix is fun urban living. It is a series of distinct urban and historical phoenix neighborhoods where neighbors know each other and are constantly welcoming new neighbors as the downtown area continues its growth.

Downtown Phoenix and the Central Avenue Corridor has enjoyed tremendous growth since the completion of light rail and ASU opening its Downtown Phoenix Campus.

You can walk for coffee, breakfast, lunch, dinner, drinks and entertainment including the First Friday Art Walk, museums, sporting events, shopping, parks and more.

It is a place populated by people seeking a way of life that doesn’t require hours of commuting each day. Many people enjoy driving any one of the many Historic Phoenix Districts just to view the architectural designs of the beautiful homes that encompass Phoenix Historic neighborhoods.

While downtown Phoenix grows, you can and experience urban living at its best. No matter what your taste there are homes that will make you happy.

Live in an area full of cultural venues and experience the convenience a downtown residence can provide whether in a modern or historic condominium, historic loft, or a townhome. Come be part of downtown life.

Contact me directly for any and all info you desire. My cell phone number is 602-400-0008.